
WEEK 6: INFERENCE
“Data Science emerged from three fields.. Statistics is the mathematical field that interprets and presents numerical data, making inferences and describing properties of the data.. Operations research, .. focused on understanding systems and taking optimal actions in the real world..(and) Computing ..the design, development, and deployment of software and hardware to manage data and complete tasks” Data Science in Context p 22. (1)
Goals
- Understand the role of inference in evidence-based policy
- Learn the importance of understanding the data generating process in inference
- Review the sources of missingness for sub-groups
Inference and evidence-based policy
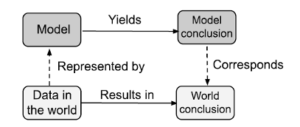
From data in the world, we build a model of some aspects of it, reason about the model to draw conclusions, and check that these conclusions correspond to what happens in the world. The better the model, the better the correspondence between the model’s conclusions and the real world. Dashed arrows denote the mapping between world and model, and solid arrows are within the world or model. Figure 1 Models and the World Source: Data Science in Context
This class is intended to train participants in the basics of using administrative data to generate evidence. There is not enough time to go into the details of developing a causal model, although there are some excellent books that should form part of an analyst’s reading list(1-3 & 5-7). Most of the focus has been on making sure that what is reported is “close” to the conceptual measure of interest. However, this section is provides a primer on, and further pointers to, the importance of understanding the data generating process in making the causal statements that are necessary to make good policy. In terms of the scoping section at the beginning of the class, the data and evidence have to be in place before Step VIII – Action – is contemplated. Figure 1 provides a nice summary- we observe some data, develop a model, draw conclusions, and ideally generalize those conclusions to the population of interest to inform that action. But there are many ways in which errors can be made. As Xiao-Li Meng has pointed out, total error is the combination of defects in data quality, data scarcity and the inherent difficulty of the problem!(4). Creating high quality evidence about education to workforce transitions so that decisions can be made requires the same inferential validity as is required in almost all social science. Do students who graduate with major x get better earnings than those who graduate with major y? Would students who graduate in major x have got better earnings if they had graduated in major y just because they are better students? (adapted from Morgan and Winship (2)). The focus in this class has been on getting the answer to the first question as close to right as possible by carefully defining terms – what does it mean to be a student; to graduate; to have a major; to have earnings – and the time period that those terms cover. Getting the data right is necessary but not sufficient to answer the second question. READ MORE
Inference and the data generating process
The structure of the Evidence Act shows the importance that Congress placed on inference in the process of generating evidence. The first Title set up the organizational infrastructure – the people who would do the work, like Chief Data Officers, Chief Evaluation Officers, and Statistical Officials. The second Title established the importance of data access. Title III highlighted the importance of statistical agencies in producing evidence. Data literacy, in other words, is not just a matter of operations and coding. Statistical thinking is required, and that means an understanding of the data generating process and how data came to be. Errors can show up in many ways. Selection bias is particularly prevalent in the data generating process in education to workforce transitions. Clearly students (and their parents) will take possible future earnings into consideration when they choose a major. As a result, we only observe earnings data on those who have self selected into the major in which they think they are going to get the highest earnings. One reason for Jim Heckman’s Nobel Prize in 2000 was the development of a technical approach correcting for selection bias – which was particularly helpful in understanding why historical analysis of the link between women’s education and earnings outcomes might be biased due to women’s higher reservation wage. Another common challenge is in data processing prior to analysis. In the Census Bureau’s Post Secondary Employment Outcomes data series, for example, outcome measures are based on the calendar year post graduation (which will commonly blend two academic years) and the earnings measures impose two labor market attachment restrictions (an earnings threshold and a number of quarters worked) that are likely to bias estimates upward for marginally attached workers. It pays to be very careful not just with your own decisions, but to examine decisions that others have made. READ MORE
Missing data for population sub-groups
Good inference requires that the analyst think about the data generating process not just in aggregate.
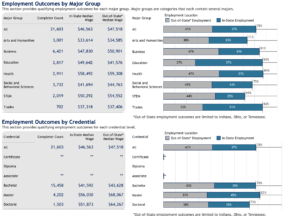
Figure 2: Earnings and employment outcomes for graduates from Northern Kentucky University in the MSPSR
A major challenge for inference, in other words, is the degree to which missingness can bias the results. For example, look at the earnings and employment outcomes for graduates from Northern Kentucky University in the MSPSR using just Kentucky data (Figure 2). Compare the employment outcomes to the employment results if Ohio data are included. The geography, in this case, is likely due to the fact that Northern Kentucky borders on Cincinnati, Ohio. Many Northern Kentucky University students are likely to have found jobs in Ohio, and so no longer show up in the Kentucky wage records. Both the employment and earnings outcomes are likely to be biased downward as a result. While it is possible to try to impute the missing values, a much more proactive approach is to build data infrastructures that enable states to share data across state lines, which is what is being done by the multi-state data collaboratives. READ MORE
Readings
- Pearl, Judea. “Causal inference in statistics: An overview.” (2009): 96-101
- Spector at al. Data Science in Context pp 147-154
- Biemer, Paul Data Quality and Inference Errors, Chapt 10 of textbook
- Nobel Prize in Economic Sciences “Information for the Public” October 11, 2000
References
- Spector AZ, Norvig P, Wiggins C, Wing JM. Data science in context: Foundations, challenges, opportunities. 2022.
- Morgan SL, Winship C. Counterfactuals and causal inference: Cambridge University Press; 2015.
- Mealli F. Answering causal questions: Angrist, Imbens and the Nobel prize. Significance. 2021;18(6):4-5.
- Meng X-L. Statistical paradises and paradoxes in big data (i) law of large populations, big data paradox, and the 2016 us presidential election. The Annals of Applied Statistics. 2018;12(2):685-726.
- Imbens GW, Rubin DB. Causal inference in statistics, social, and biomedical sciences: Cambridge University Press; 2015.
- Pearl J. Causality: Cambridge university press; 2009.
- Pearl J. Causal inference in statistics: An overview. 2009.