
Week 5: Analytics
“there is a substantial opportunity for federal officials to use state data to evaluate programs that are delivered at the state and local levels. State administrative data could provide valuable insights to inform federal decision-making, and federal agencies could adopt best practices modeled by the states. State data are often more specific to small geographies and more current than federal data. As such, state data could prove invaluable for monitoring the impact of government interventions intended to benefit small regions recovering from economic or natural disasters in a timely and actionable manner.”
ACDEB Year 2 Report p 20 (1)
Goals
- Learn how to apply a theory of change to the use case
- Discover the basics of Machine Learning
- Explore how to evaluate results
- Understand how to identify and reduce common errors
Scoping the project
Impact Evaluation in Practice – https://openknowledge.worldbank.org/entities/publication/ebbe3565-69ff-5fe2-b65d-11329cf45293
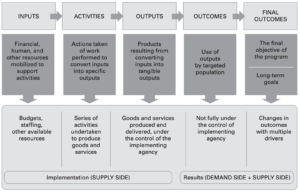
The goal of this training class is to provide an overview of how to work with data to create evidence. In order to turn data into evidence, analysts need to build the basics of a theory of change or a results chain where each step can be measured (Step V of the evidence framework described in the scoping prework). That involves clearly defining the goals of the project, the inputs and activities that will be mobilized by the expected interventions, and the outputs and outcomes of interest(2). While it may be that the initial focus of producing evidence is simply to describe the current environment, or detecting whether there are some challenges that need to be addressed, there are likely to be policies that are developed as a result of the evidence, and decisionmakers will want to predict the effects of those policy interventions. The work done in the class so far, and the MultiState Postsecondary Report, are both descriptive in nature. READ MORE
Knowing the population
One of the most difficult challenges of dealing with administrative data is that you are often dealing with a population that is not the full population – it is the population for which data are available. So in our education-workforce case, information is not available on students enrolled in private sector educational institutions. Information on jobs is only available for students who get jobs within their state – although states are banding together to share information across state lines (so far, Indiana, Tennessee, Ohio and Kentucky are participating in the activity, with other states joining shortly). That means that analysts have to be very careful in cautioning policy makers about the limitations of the analysis. It also means that, missing data on jobs, for example, may be a consequence of a graduate not being able to get a job at all or having got a job out of state. If the former is the case, and missing data are dropped from the analysis, estimates of the impact of education on job quality will be biased up. If the latter is the case, and missing data are dropped from the analysis, then estimates of the impact of education on job quality will be biased down. Worse, if there are different propensities to move out of state for some institutions – like Northern Kentucky University, which borders Cincinnati – the biases will be different by institution. The same holds true if there are different propensities for different majors or demographic groups. The results of biased analysis will be biased evidence and possibly unintended consequences for policy. READ MORE
What will be changed?
This question is intended to translate information about the theory of change to something that is operationally actionable. For example, a common current policy goal is to ensure that the state has more teachers or nurses. Descriptive evidence may have found that education (or nursing) majors find “better jobs” – as measured by higher earnings – in industries other than the education (or health care) industry. The policy intervention for education, for example, might be to (i) invest more resources into education majors to increase the pipeline, (ii) to provide financial support to education majors to reduce attrition, or (iii) increase earnings for publicly funded teachers to encourage education majors to go into the intended industries. The data structure, and the measures that the analyst developed, needs to reflect information about these and other majors, describe the pathways that students take to graduate with that major, the relevant levers of interest and the outcome measures. So, for example, the analyst needs to define what it means to enroll in and then graduate with a degree in education. Then what it means to get a job in the education industry – is it one, three or five years out and how long should that job last to count? READ MORE
Machine learning
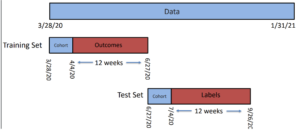
Creating training and test datasets (source, Rayid Ghani)
All analysts are, or should be, familiar with the basics of setting up a machine learning (ML) problem. It is no different from setting up a logistic regression model. The first step involves identifying a unit of prediction, otherwise known as the rows of the dataset. The second step is defining and creating a binary outcome measure (with success coded as 1 and failure coded as 0), which in statistics is called a dependent variable but in computer science is called a label. Next comes identifying the predictors, called independent variables in statistics, but features in computer science. A major difference between statistics and ML is that ideally the statistician estimates a parsimonious model and then uses the results for hypothesis testing. In ML, the goal is typically prediction, so the data analyst can use as many features as possible – anything and everything about the person and the world at the time of prediction – and much of the focus is to set up well labelled training and test datasets, estimate a model on the training set, and then see how well the prediction works on the test set. Many such models are available – regression, decision trees, support vector machines, Bayesian models, random forests, boosting and neural networks. READ MORE
Basics of evaluation
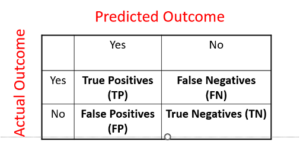
A confusion matrix
Since good predictions are the goal of any evidence based policy intervention, the models need to be evaluated to judge the quality of the prediction. The basic tool at hand for this purpose is the confusion matrix. The model estimated on the training dataset is applied to the test (validation) dataset to predict the outcome of interest. Since predictions are often scores between 0 and 1, the analyst needs to choose a threshold (.9? .8? .5?) at which the predicted outcome is converted to either a 0 or a 1, and then the predicted outcome is compared to the actual. Now the analyst has to figure out what is a “good” model. Is it a model that, when it says an outcome is true, is almost always right? That’s called high precision (the proportion of true positives relative to all outcomes predicted to be positive). Or is it a model that captures as many true outcomes as possible? That’s called high recall (the proportion of true positives relative to all actual positives). There is a direct tradeoff between the two measures, as the threshold gets varied. There’s likely to be a great deal of difference in the cost to the taxpayer on the one hand, and the benefit to education majors on the other. READ MORE
What to watch out for
One of the dangers of learning the basics of machine learning is that while it is easy to set up and estimate a model, it is also easy to make many mistakes.(3) Some very common errors include the failure to think about what a baseline model (one without any features) would predict – such as the mean outcome in the population. The analyst should always compare how much better the model does relative to a simple calculation of the mean (for example, in terms of precision, recall, or accuracy). Another error is not considering the loss function carefully. There is no absolute definition of “best” choice of precision or recall; the choice involves weighing the relative costs and benefits of false positives versus false negatives. The analyst may need to go back to the decision maker (Step 1 of the Evidence Framework) with the results of the model to get guidance on what tradeoff to accept, and what threshold to choose. Another important consideration is possible differences in the policy impact on different demographic groups, majors, or geographic areas – especially given limited resources.(4) READ MORE
Food for thought
It is always important to think of the “unanticipated consequences” of a policy. Josh Hawley in an email correspondence highlighted an example with Career and Technical Education (CTE). “In 1990 we changed CTE courses to be more general and to require fewer hours of practical training. This was because we assumed that all high school students were going to college. Fast forward, 20 years and most CTE students were going to college, but the ones that were not, lacked adequate technical instruction to enter key professions, such as welding or nursing. Those students now must spend time in post-secondary education instead of receiving all the technical instruction in high school for free.” READ MORE
Readings
- Chapter 7 of textbook
- Advisory Committee on Data for Evidence Building, Year 2 report (1) Recommendations 1.4 (p23-25)
References
- Advisory Committee on Data for Evidence Building. Advisory Committee on Data for Evidence Building: Year 2 Report Washington DC2022.
- Gertler PJ, Martinez S, Premand P, Rawlings LB, Vermeersch CM. Impact evaluation in practice: World Bank Publications; 2016.
- Spector AZ, Norvig P, Wiggins C, Wing JM. Data science in context: Foundations, challenges, opportunities. 2022.
- Saleiro P, Kuester B, Hinkson L, London J, Stevens A, Anisfeld A, et al. Aequitas: A bias and fairness audit toolkit. arXiv preprint arXiv:181105577. 2018.