
WEEK 3: Measurement
“It’s hard to trust employment data from the Chinese government, which counts anyone who has worked one hour a week.” NY Times June 28, 2023; “People are counted as employed if they did any work at all for pay or profit in the survey reference week” US employment measure definition, Current Population Survey.
Goals
- Learn how measures can be constructed from data
- Learn how to think about measurement quality
- Discover how to measure errors
Mapping policy concepts to measures
Legislators or managers set a policy question; analysts have to map the question to data so that it can be measured. Take the use case question: “What kind of jobs do students get after graduation”? Before doing the mapping, the analyst needs to find out how the manager defines “job” or “employment”. That’s referred to as identifying the underlying target concept (Step II in the measurement framework in the scoping prework); the construct is likely to differ for each agency and for each state. In practice, not many legislators or managers are likely to accept a measure of employment that is one hour of paid work a week, so the analyst is going to have to ask them which available measure is the one closest to what is acceptable (the target concept). And, since one aspect of data quality is minimizing the gap between measurement and construct, it’s best to set realistic expectations early on. READ MORE
Why does measurement matter?
Measurement is hard in general, but it’s very hard in public service. Simply put, what you measure is what you get. It’s ironic that one of the “best documented instances of dysfunctional measurement in an organizational setting” is an employment office. The government office had the stated purpose to server workers seeking employment and employers seeking workers”. Early in the study period, employment interviewers were evaluated by the number of interviews they conducted. …..the interviewer’s interest in a good rating demanded that he maximize the number of interviews and therefore prohibited spending much time locating jobs for clients” (1). In our use case, a focus on job quality that measured only job duration would encourage institutions to get their graduates to stay in jobs they were not suited for; a focus on job quality that measured getting jobs immediately would not set them up for the best job possible; a focus that measured high earnings alone might not set them up for jobs with earnings growth…and so on. READ MORE
Defining the target concept: What is being measured
It is important to spend serious time determining exactly what target concept is being measured. There are two sets of constructs in our use case: one addresses education concepts; the other addresses labor market outcomes. The Department of Education has worked hard to determine how to identify when a student starts education and when they complete or don’t complete a course of study, or simply are in and out of education; defining completion too soon means that “real” graduation rates are skewed down, but too late means that problems are not identified in a timely fashion. The Department of Labor has worked hard to determine how to measure employment outcomes for WIOA, yet defining simply “getting a job” as a success leads to perverse incentives for training providers. States have stepped up to the challenge in very thoughtful ways: read the 36 page technical report for the Multistate State Postsecondary Report which shows how agency staff from Kentucky, Ohio, and Indiana tried to identify constructs and measure carefully and with respect for the data. READ MORE
Measuring quality
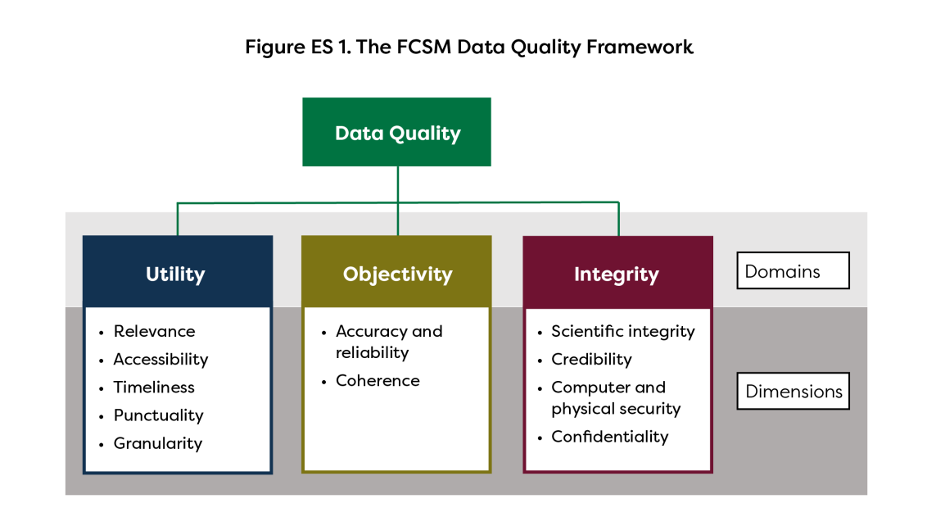
The FCSM Data Quality Framework (Source, FCSM
As noted above, many people think of quality measurement as simply being the gap between the actual measure and the underlying target concept, but it’s not that simple. The Federal Committee on Statistical Methodology (FCSM) has a very intuitive graphic that spells out multiple dimensions. Data users – like students or institutions – put a lot of emphasis on data utility(2). They’re interested in relevant, accessible, and timely the data are(3). Students also care about whether the data are granular enough to answer questions about the jobs and earnings they are likely to get in their local labor markets, in their major, and for people with their demographic characteristics. Institutions, who are trying to counsel students and report to their legislators, have the same utility questions. Data providers – like state agencies – have additional concerns, like objectivity and integrity. Their reputation depends on the accuracy and reliability of what is produced(4, 5). As noted in the prework (Legal Framework), they have a statutory responsibility to protect integrity – particularly confidentiality. All of these need to be balanced. READ MORE
Measurement error
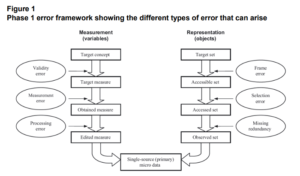
Error sources in administrative data (Statistics New Zealand)
It is sometimes paralyzing to think of all the different sources of error in administrative data. Fortunately, there has been a lot of work in developing a framework that helps analysts organizes the sources of error. The Total Survey Error Framework, which has been a very important approach to understanding sources of error in surveys has been modified to better understand the sources of error in administrative data(6). READ MORE
Missingness
One of the biggest challenges in measurement with administrative data is a result of the fact that the data are generated from government programs. As a result, data can be missing on an individual for many reasons – for example, they moved out of state, they stopped participating in the program because they started doing something else, there were errors in linking the files and so on. The results for measurement quality can fundamentally change the analysis depending on whether the analyst decides to delete observations with missing values, replace missing values with zeros, replace missing values with the mean for the group, or “impute” missing values. READ MORE
Data quality challenges
The issues identified in this section are a very simplified overview of the data quality issues in administrative data. In the Hand et al. (6) list of the 15 biggest challenges in working with administrative data, five of the first six deal with addressing data quality issues
- Challenge 1. Statistics teaching should cover data quality issues
- Challenge 2. Develop detectors for particular quality issues.
- Challenge 3. Construct quality metrics and quality scorecards for data sets.
- Challenge 4. Audit data sources for quality.
- Challenge 6. Evaluate the impact of data quality on statistical conclusions. Report changes and time series with appropriate measures of uncertainty,so that both the statistical and the substantive significance of changes can be evaluated. The measures of uncertainty should include all sources of uncertainty which can be identified. David Hand et al Statistical challenges of administrative and transaction data. READ MORE
Food for thought
“The birth of the modern definition of unemployment represents a remarkable triumph of practical measurement needs over persistent concerns about the absence of theoretical underpinnings. Economists continue to remain skeptical of any single theoretical definition of “unemployment.” In the end, however, the profession has largely accepted the measurement techniques developed by statisticians at the Works Progress Administration and the Census Bureau in the late 1930s” David Card in “Origins of the Unemployment Rate: The Lasting Legacy of Measurement without Theory” (6). READ MORE
Readings
- WIOA Performance Indicators and Measures
- Statistics New Zealand Guide to reporting on administrative data quality (16 Nov 2022)
- Guide to Report on Administrative Data Quality (p7-9)
References
- Austin RD. Measuring and managing performance in organizations: Addison-Wesley; 2013.
- Advisory Committee on Data for Evidence Building. Advisory Committee on Data for Evidence Building: Year 2 Report Washington DC2022.
- Lane J. Reimagining Labor Market Information: A National Collaborative for Local Workforce Information. Washington DC: American Enterprise Institute; 2023.
- Trewin D, Andersen A, Beridze T, Biggeri L, Fellegi I, Toczynski T. Managing statistical confidentiality and microdata access: Principles and guidelines of good practice. Geneva, UNECE/CES. 2007.
- National Academies of Sciences E, Medicine. Principles and practices for a federal statistical agency. 2017.
- Card D. Origins of the unemployment rate: the lasting legacy of measurement without theory. American Economic Review. 2011;101(3):552-57.
- Hand DJ, Babb P, Zhang L-C, Allin P, Wallgren A, Wallgren B, et al. Statistical challenges of administrative and transaction data. Journal of the Royal Statistical Society Series A (Statistics in Society). 2018;181(3):555-605.