Feb 16, 2021
By Frauke Kreuter, Esther Kim, Andy Garcia, Sarah LaRocca, Katherine Morris, Frances Wang, Carly Lupton-Smith, Ting-Hsuan Chang, Xiaoyi Deng, Andres Garcia
The Global COVID-19 Trends and Impact Survey
The Global COVID-19 Trends and Impact Survey is one of the largest global data collection efforts related to COVID-19. The international version of the survey is conducted by the University of Maryland’s Joint Program in Survey Methodology in partnership with Facebook Data for Good, and is currently fielding in 200+ countries and territories in 55+ languages. Since its launch in April, 2020, over 38 million responses have been collected, enabling policymakers and researchers to track daily symptoms, testing, preventive health behaviors, mental health, economic anxiety, and much more. The US version of the UMD Global CTIS is conducted by our partner, Carnegie Mellon University.
We encourage researchers, public health officials, and the public to use the survey data and tools available. Public, aggregated data are available through the University of Maryland’s API for the global survey and through Carnegie Mellon University’s API for the US survey. Microdata are also available upon request to academic and nonprofit researchers under data license agreements. For more information on complementary data from Germany can be found here https://www.corona-datenplattform.de/.
New COVID-19 Vaccination Module
In December, the University of Maryland and Carnegie Mellon University, in partnership with Facebook, began collaborating with the U.S. Centers for Disease Control and Prevention (CDC) to incorporate a COVID-19 vaccination module in the UMD Global CTIS to support the COVID-19 vaccination programs that are rolling out globally. The newly added questions will enable our survey to track daily vaccination uptake, measure vaccine-related sentiments, and examine how trends vary across different population subgroups in real-time, which is a unique value of the UMD Global CTIS. More specifically, the new module (and future versions) will aim to address the following critical public health questions:
- How many people are vaccinated? Of those who are vaccinated, how many received the complete set of doses?
- How many people are hesitant about getting vaccinated? What are the reasons? How many are worried about experiencing a side effect?
- Are there barriers to accessing either vaccinations or information about vaccinations?
- Would individuals be more likely to get vaccinated if it were recommended by certain information sources?
- How do the responses to these questions vary by sociodemographic status such as occupation, age, gender, and race or ethnicity? How do these vary by clinical risk factors?
Insights from the New COVID-19 Vaccination Data
The Global COVID-19 Trends and Impact Survey is one of the few data sources that tracks daily self-reported vaccinations in combination with vaccination-related sentiments in more than 80 countries and territories. The new vaccination questions were added across Waves 7 and 8 of the survey, which were launched on December 21, 2020, and on January 14, 2021, respectively. Below, we analyzed over 6 million responses collected from these new waves of the survey to highlight how we can better understand trends on vaccination uptake, vaccine acceptance, trust in information sources, and concerns related to side effects of the vaccine. This information can be used to shape future public health interventions and vaccine messaging campaigns.
COVID-19 Vaccination Uptake
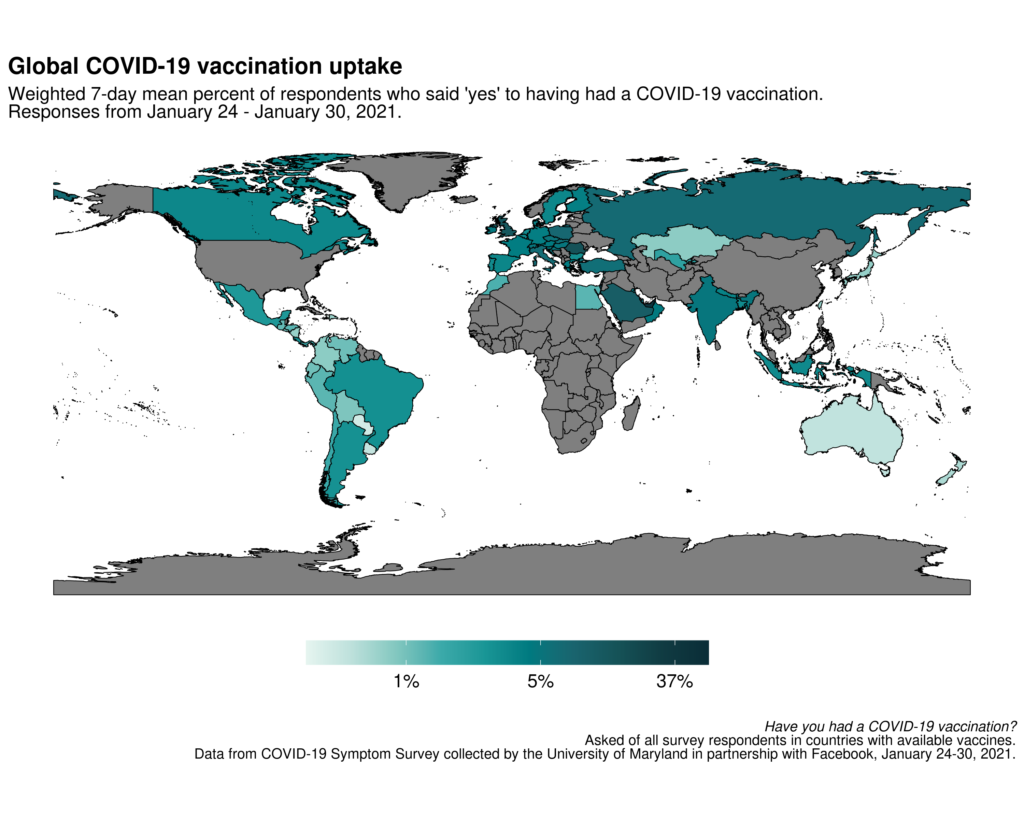
As COVID-19 vaccinations are ramping up globally, we can use the UMD Global CTIS data to examine the estimated percentages of vaccination uptake across countries. We examined self-reported vaccinations in 63 countries and territories where a COVID-19 vaccine is approved and available, and where there are sufficient survey responses to provide weighted country-level estimates. The map below depicts that the estimated vaccination rates vary considerably across regions and countries. If you are particularly interested in COVID-19 vaccination uptake and sentiment trends in the United States, which we do not cover in this blog post, please check out a separate post that uses the US version of the UMD Global CTIS.
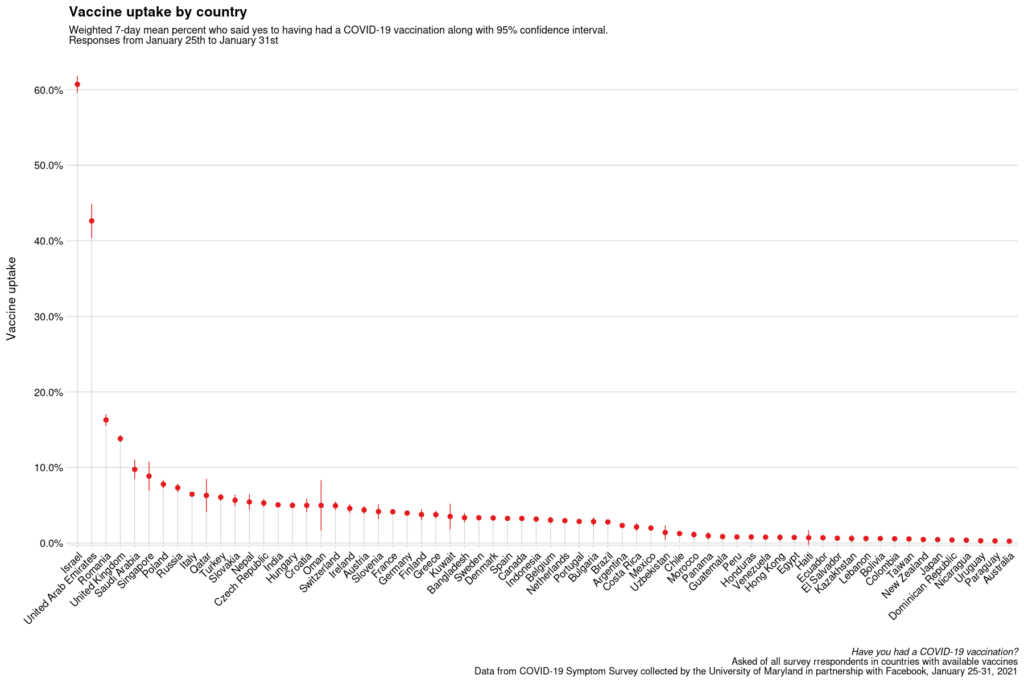
When comparing country-level estimates of vaccination uptake, we observe the highest self-reported vaccination rates among Israel, UAE, and UK, which is similar to trends reported in other data sources (1, 2).
The estimated percentages may differ from external data on vaccine administration in various countries for several reasons. There can be a reporting bias in the survey data, with an overreport of the socially desirable behavior (getting vaccinated) but also a lag in official reporting of vaccination administration, which would lead to an underestimation through the external data source. We plan to assess these biases as more data is collected. Irrespectively, we expect the biases in the survey to be constant from day-to-day allowing successful monitoring of changes over time within each country going forward.
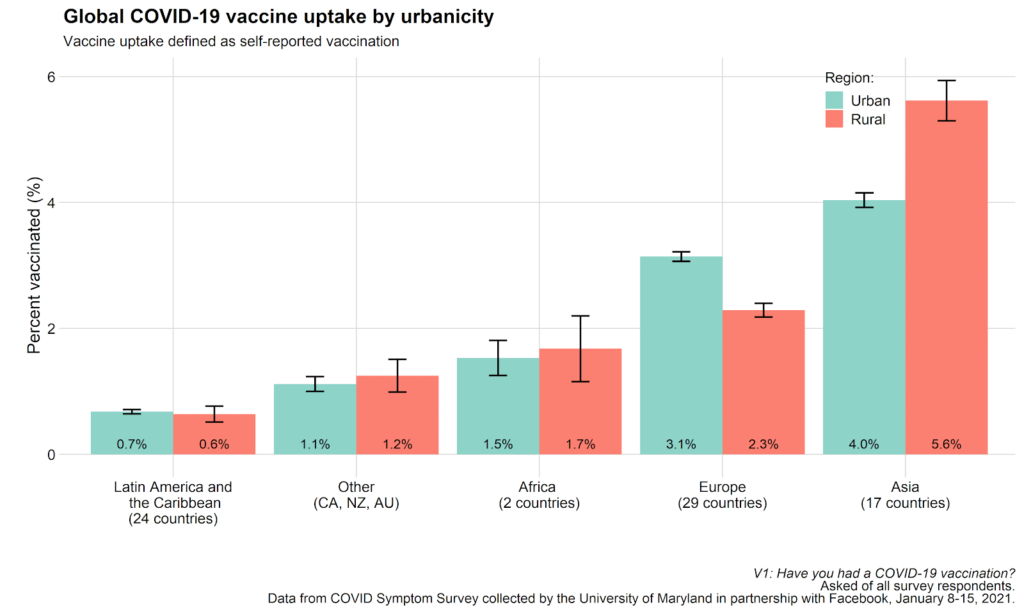
Using our survey data, we can also examine potential inequities in how vaccines are administered globally. Below, we illustrate how self-reported vaccination rates vary by various sociodemographic factors such as urbanicity, which is categorized as individuals living in urban areas (i.e., city and town) or rural areas (i.e., rural or village). In the figure below, the countries are categorized into Latin America and the Caribbean, Africa, Europe, and Asia according to the United Nations classification. We find that in Europe, there is a higher estimated vaccination uptake in urban areas, whereas in Asia, we see a higher rate in rural areas. Among the remaining regions, we do not see significant differences by urbanicity.
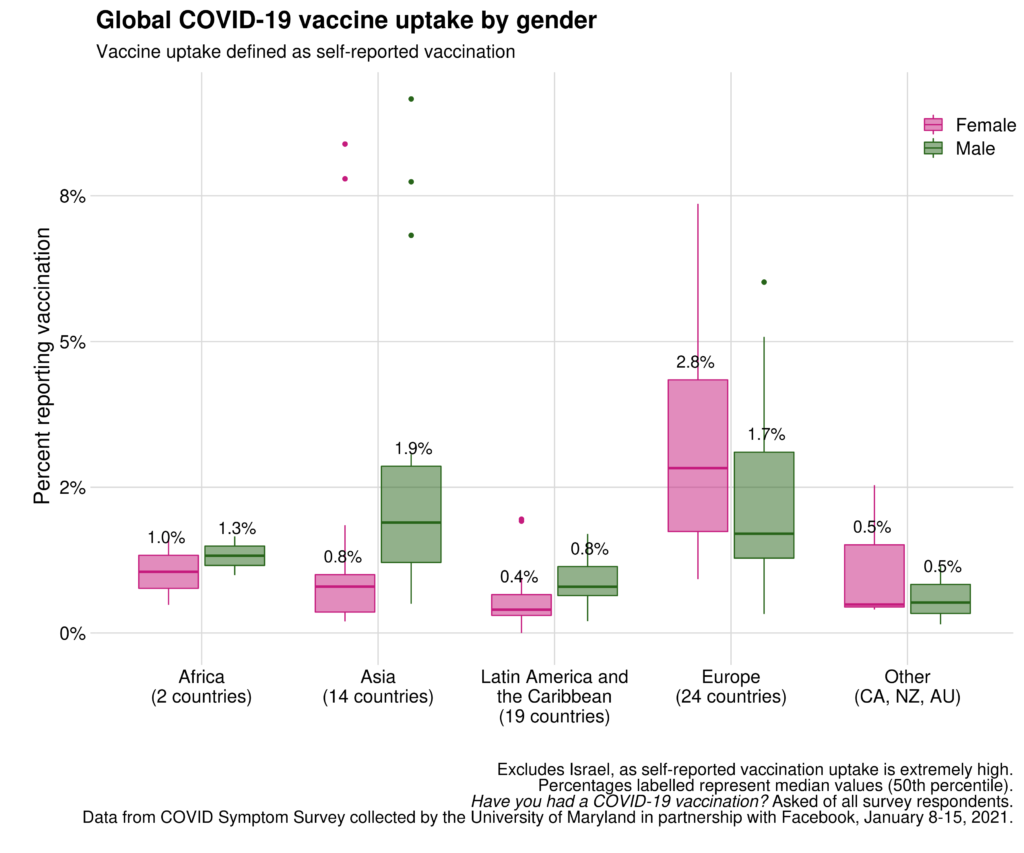
When broken down by gender (defined here as female and male only due to a small percentage of respondents who self-reported as ‘other’), there seems to be higher vaccination uptake among males in Asia, Latin America, and the Caribbean, while in Europe we observe higher uptake among females.
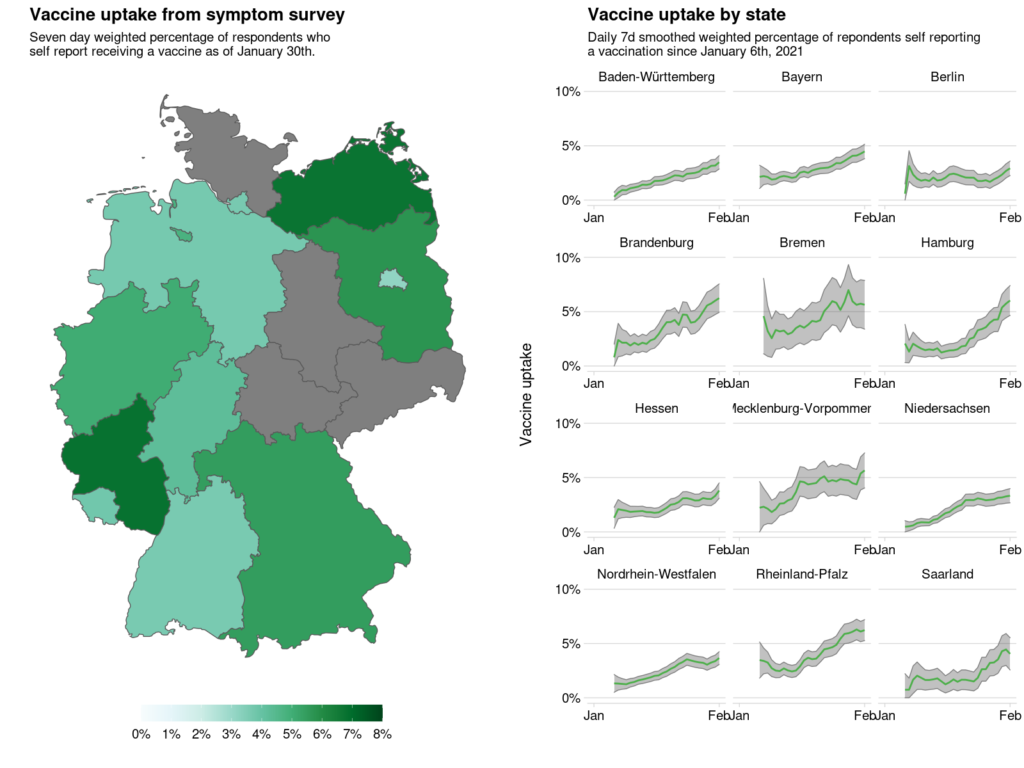
In addition to sociodemographic and cross-country comparisons, the UMD Global CTIS allows more granular tracking and comparisons of vaccination uptake at a subnational regional level. Below, we demonstrate how the estimated vaccination uptake varies across administrative regions in Germany.
While the estimated percentages of vaccination in certain states may differ from official sources, such as those from the Robert Koch Institute for various reasons as we noted above, we find that the trends observed across states are moderately similar to external data.
The map above depicts a higher proportion of self-reported vaccination uptake in the eastern regions compared to western regions. The grey regions indicate inadequate number of responses that prevents aggregate reporting. When we compare the rates across time, we notice that for all regions, self-reported vaccination increases over time, though, the rate seems to be more stagnant in Berlin.
Vaccination among Priority Groups (Healthcare Workers and Older Individuals)
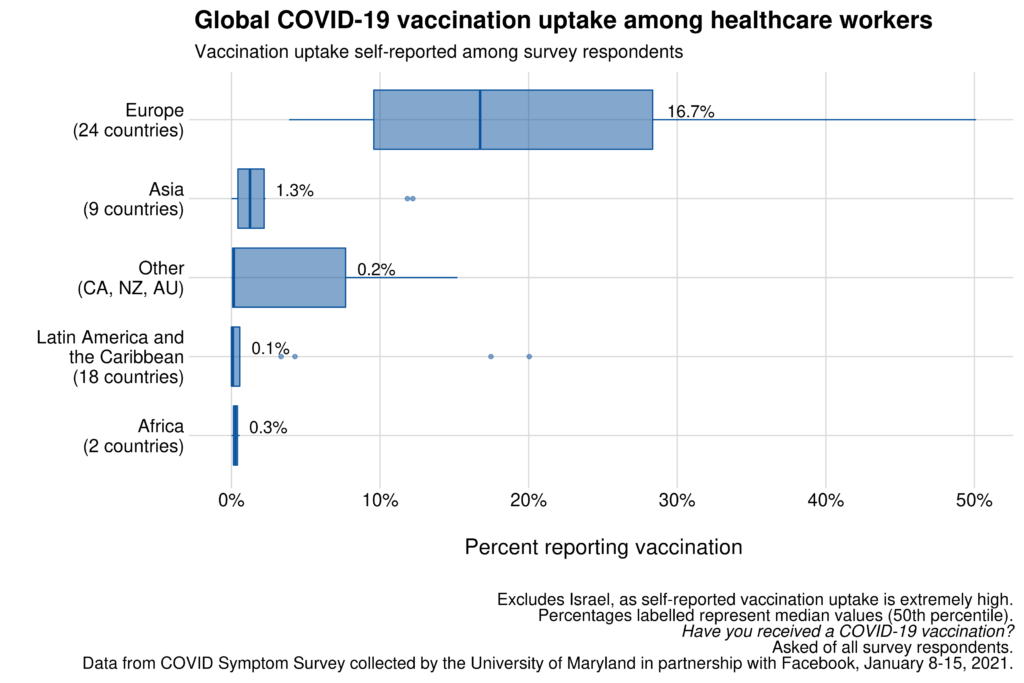
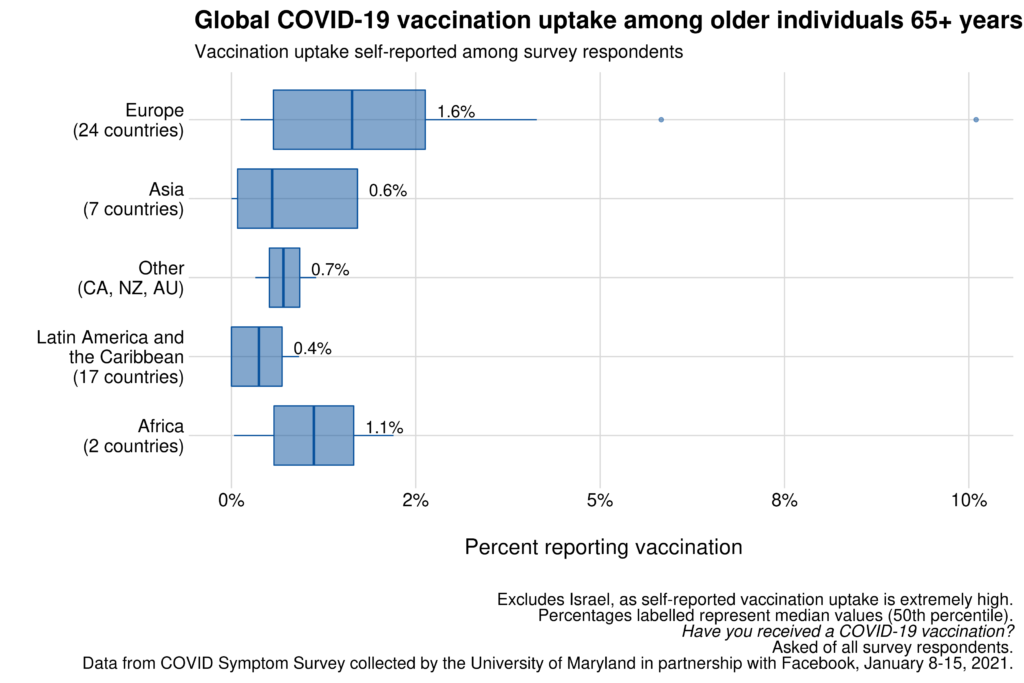
The WHO currently recommends COVID-19 vaccination prioritization among healthcare workers and older individuals (Stages 1a and 1b). Using the UMD Global CTIS, we are able to track how vaccinations are rolling out among these two priority groups. We classified the respondents as healthcare workers if they indicated that their job can be categorized as either “healthcare practitioner or technician” or “healthcare support” (this includes, doctors, nurses, pharmacists, dentists, technicians, and many related fields), and older individuals were defined as respondents aged 65+ years.
We observe a large distribution of self-reported vaccination rates among healthcare workers globally. The median proportion of uptake among healthcare workers is the highest in Europe (16.7%), followed by Asia (1.3%) and the rest of the regions, which are reporting a median percentage of <1%.
Compared to the vaccination rates among healthcare workers, we find significantly lower rates among older individuals aged 65+ years. The median proportion of older individuals reporting vaccinations is lower than 2% across all regions, suggesting the continued need for prioritization among older individuals.
Vaccine Acceptance
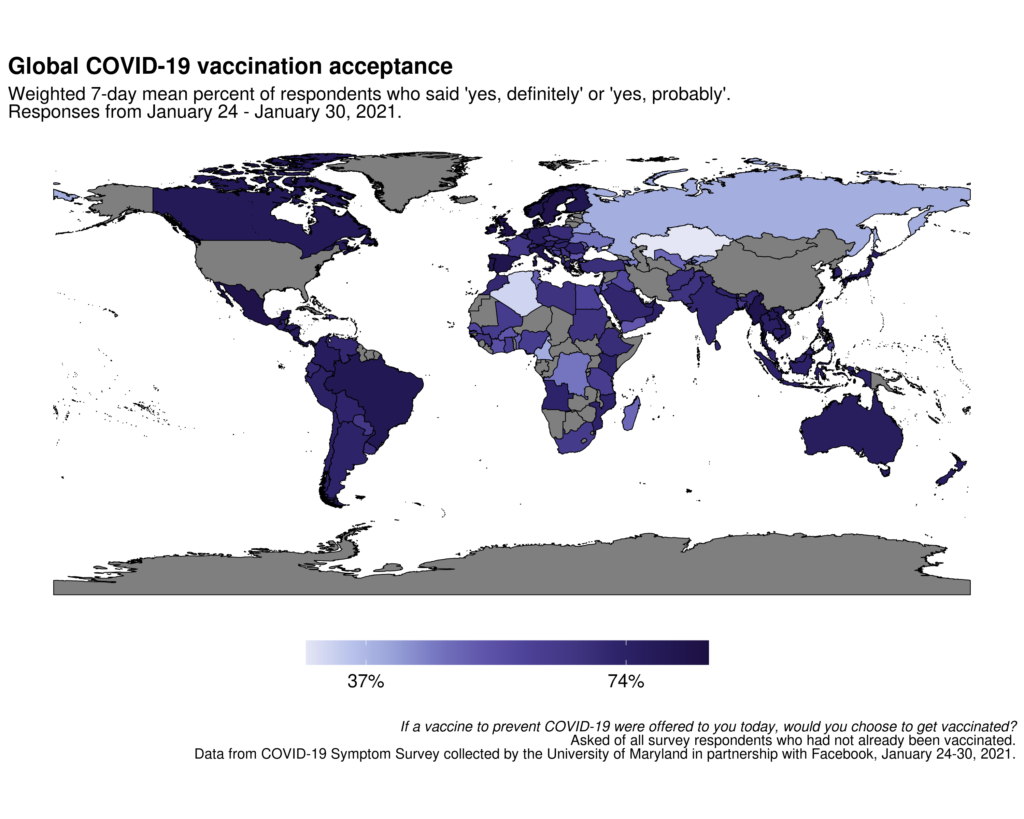
Although more than 119 million doses have been administered globally, the majority of the world’s population have yet to receive a vaccination. Among those who are not yet vaccinated, it will be important to understand their willingness to receive a vaccination so that we can better inform and shape future public health campaigns. The map below depicts the estimated percentages of vaccine acceptance, defined as individuals reporting that they would definitely or probably choose to get vaccinated. We examined 114 countries that had sufficient responses to the question ‘If a vaccine to prevent COVID-19 were offered to you today, would you choose to get vaccinated?’.
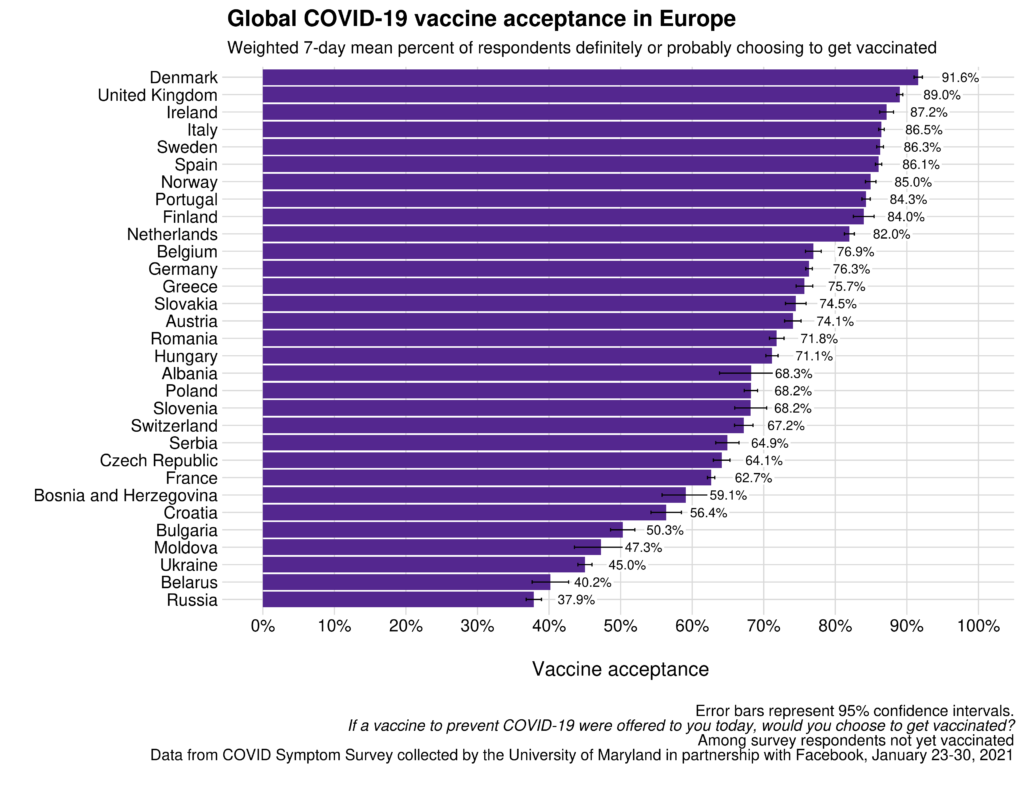
The above map illustrates that vaccine acceptance varies significantly across the countries, ranging from <40% to >90%. In Europe for example, the countries with the highest vaccine acceptance (>85%) as of January 30, 2021 are Denmark, United Kingdom, Ireland, Italy, Sweden, Spain, and Norway, while the countries with the lowest vaccine acceptance (<60%) are Russia, Belarus, Ukraine, Moldova, Bulgaria, Croatia, and Bosnia and Herzegovina.
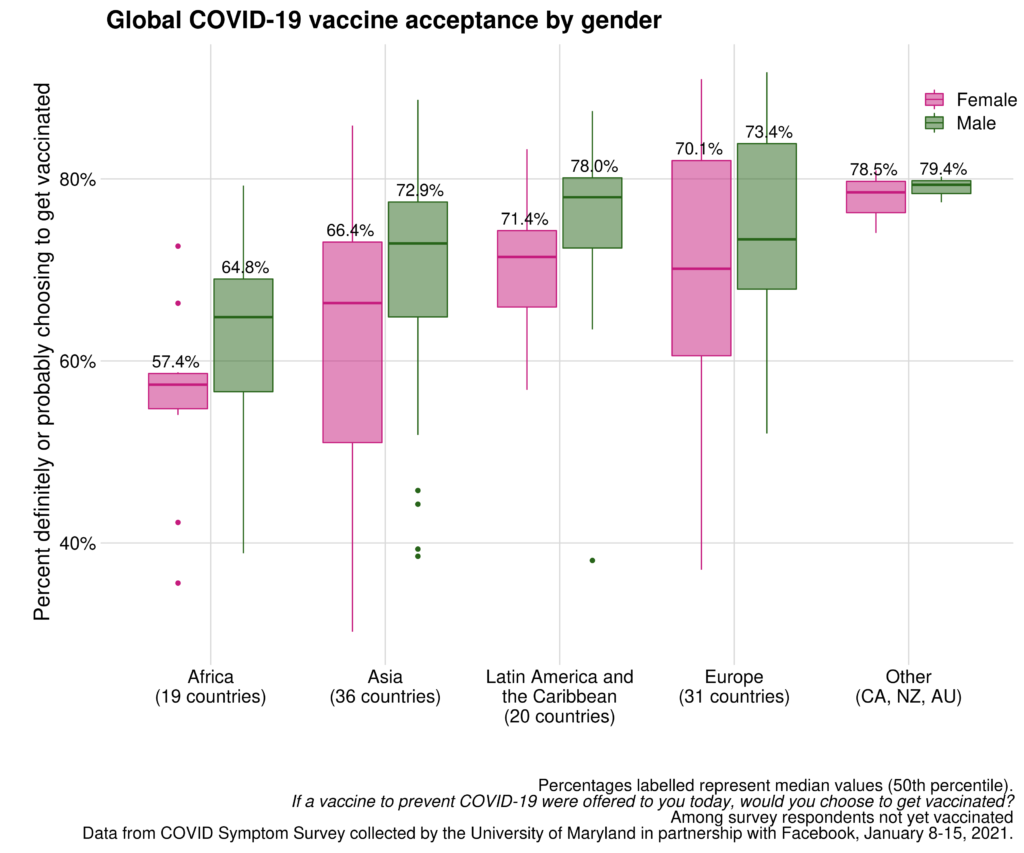
We can also analyze vaccine acceptance by various sociodemographic factors to better understand gaps and disparities that may exist in individuals’ willingness to get vaccinated. We find that when comparing vaccine acceptance rates by gender, there is a larger gap between female and male among countries in Africa, Asia, and Latin America and the Caribbean, compared to Europe and other remaining countries (i.e., Canada, Australia, New Zealand).
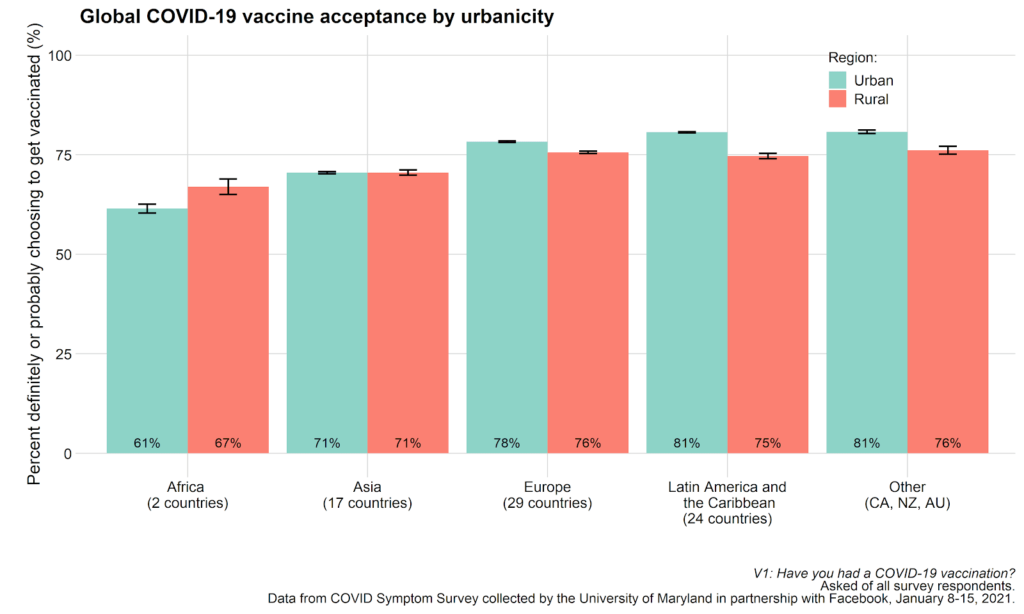
When comparing by urbanicity, vaccine acceptance rates seem generally similar between those living in urban and rural areas; though, the rates are slightly higher in urban areas among countries in Europe and Latin America and the Caribbean, and we see a similar pattern in Canada, New Zealand, and Australia.
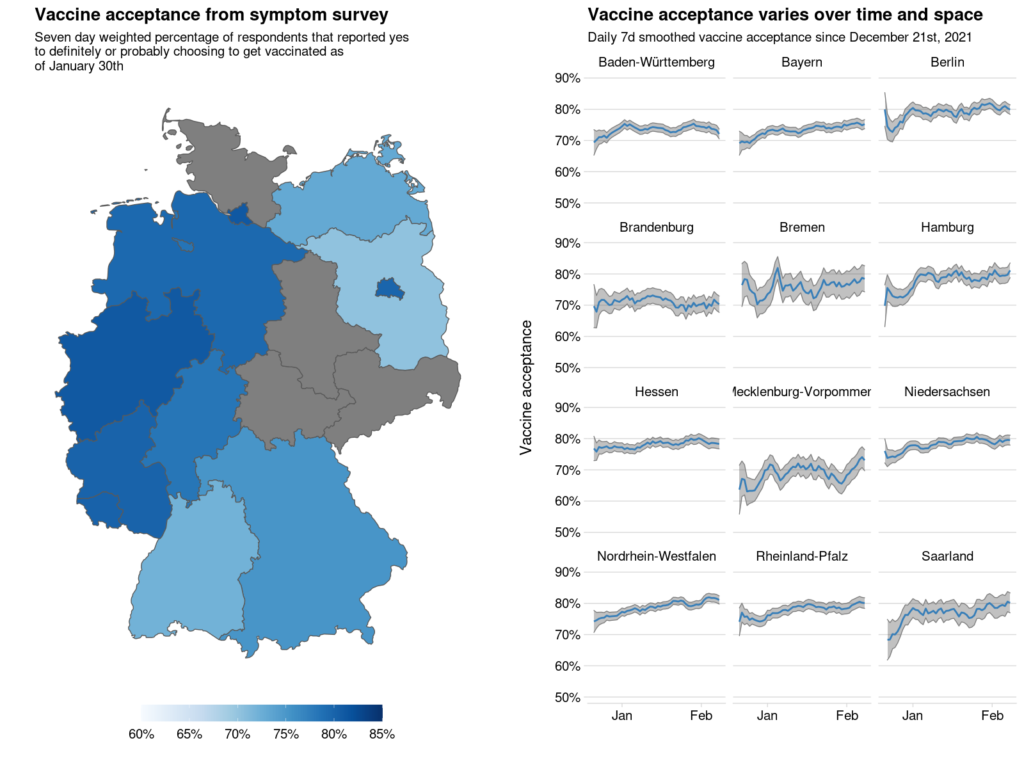
We are also able to compare vaccine acceptance rates across subnational regions. In Germany, for example, we find that acceptance rates are higher in the western regions compared to eastern regions, and that the acceptance rates across administrative regions have not changed significantly over the last month. Interestingly, we observe low vaccine acceptance rates in eastern regions where we observed high estimated vaccination rates; however, this is reasonable, as vaccinations are highly prioritized, limited in supply, and not accessible for everyone; therefore, vaccine acceptance may not strongly correlate with uptake.
Trust in Information Sources
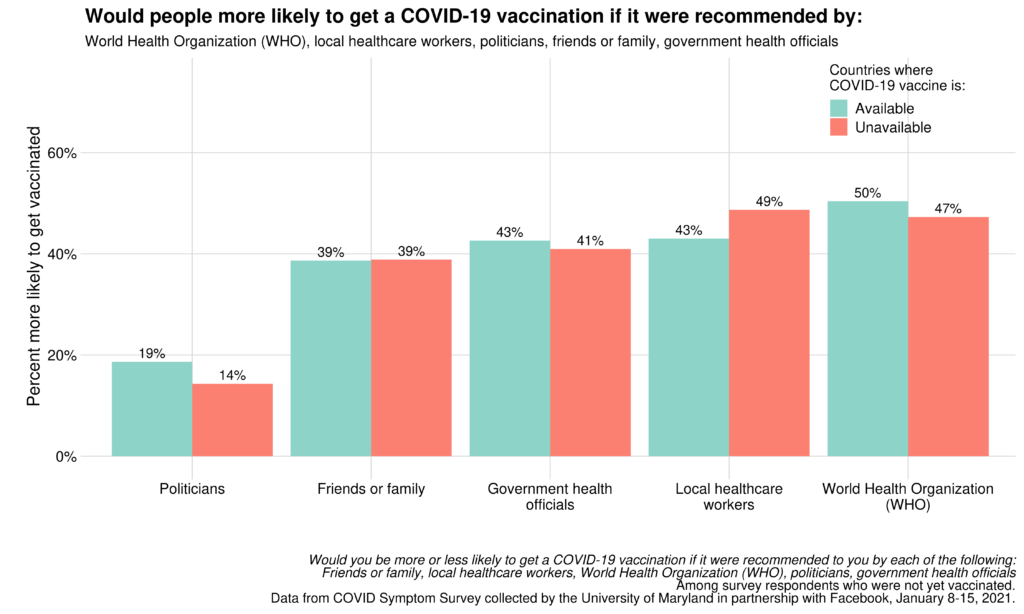
To increase vaccine acceptance across the world, it will be helpful for policymakers to understand which information sources can increase one’s willingness to get vaccinated. Starting in December, we have asked our survey respondents, “Would you be more or less likely to get a COVID-19 vaccination if it were recommended to you by each of the following? Friends or family, local healthcare workers, World Health Organization (WHO), politicians, or governmental health officials”. Our data demonstrates that overall, respondents are most likely to get vaccinated if it were recommended by authoritative sources like the WHO and local healthcare workers, and this is consistent regardless of countries having secured vaccines.
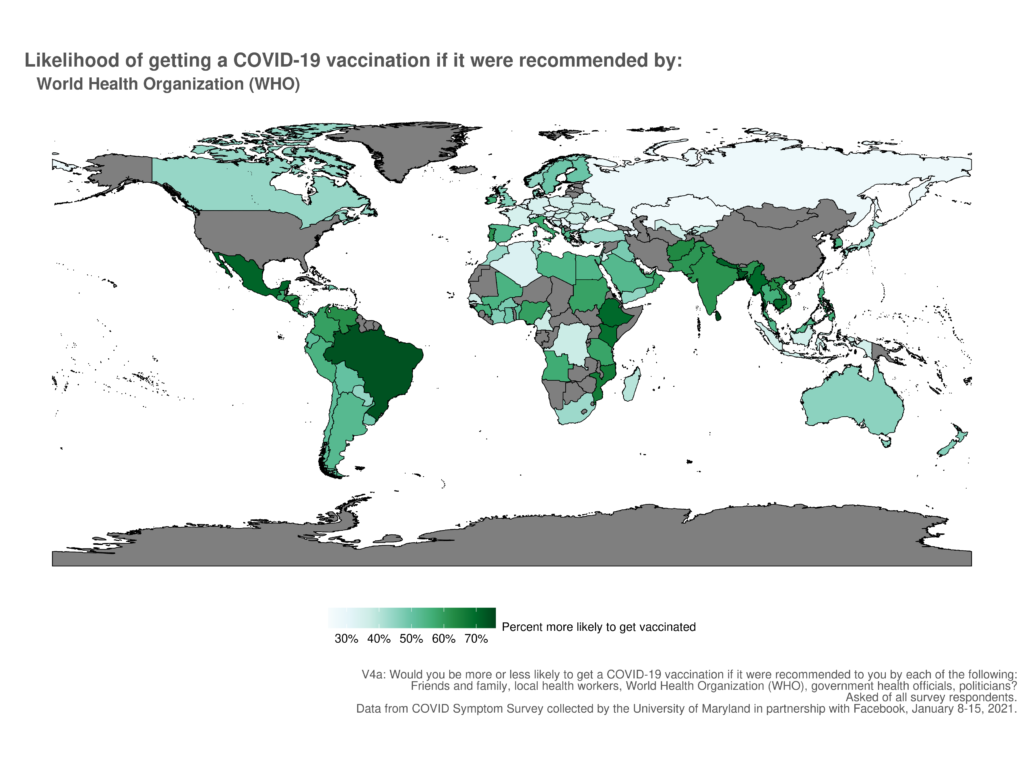
Though recommendations from the WHO are the most trusted among other information sources, the estimated proportion of adults reporting that they would be more willing to get vaccinated due to the recommendation varies considerably across countries, ranging from <30% to >70%. It is generally the highest among countries in Asia and in Latin America and the Caribbean, and the lowest in Europe.
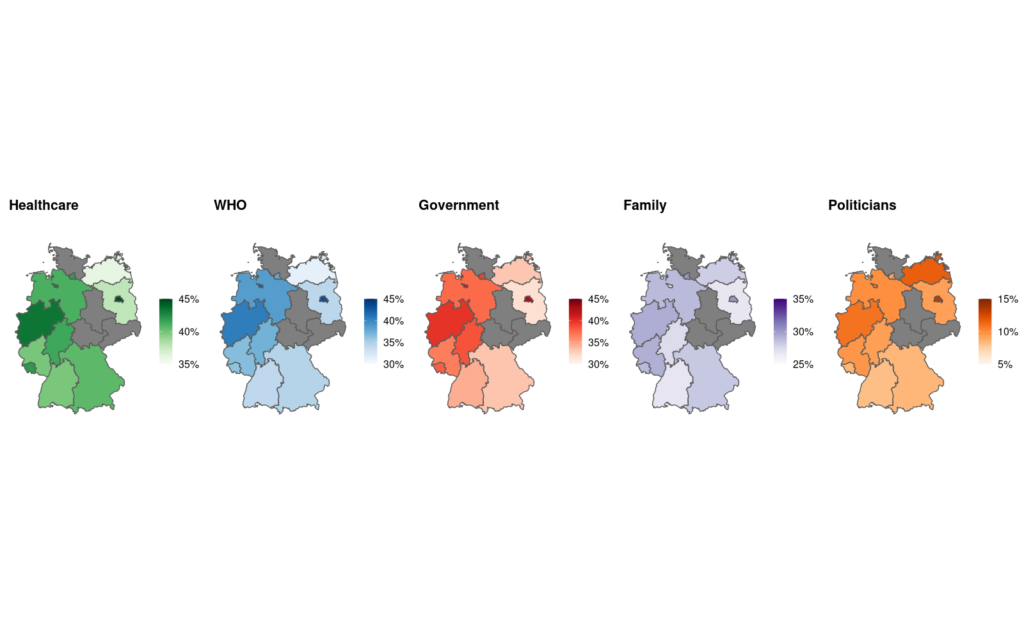
In addition to cross-country differences, trust in various information sources also differ across subnational regions, which has implications for local health workers and policymakers as they continue to develop and shape vaccination campaigns for their communities. In Germany, for example, individuals in western regions are more likely to get vaccinated based on recommendations from authoritative sources compared to politicians, friends, or family members; while those in Brandenburg are more likely to get vaccinated if it were recommended by friends and family members compared to the WHO.
Concerns about Side Effects
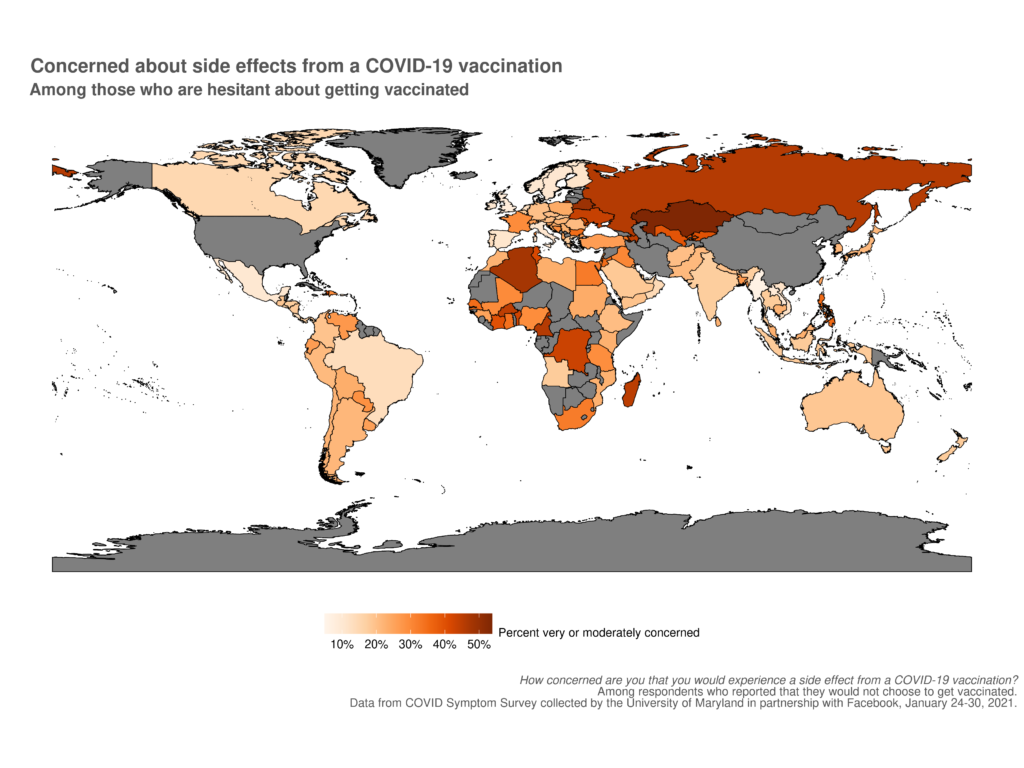
To increase vaccination uptake and acceptance worldwide, it will be important to understand potential underlying reasons for vaccine hesitancy. A potential barrier to getting vaccinated may be concerns related to side effects from a vaccination. We therefore included the following question in the Global COVID-19 Trends and Impact Survey: “How concerned are you that you would experience a side effect from a COVID-19 vaccination?”
Below, we examine the distributions of those reporting that they are very or moderately concerned about side effects among respondents who are vaccine-hesitant (definitely or probably choosing not to get vaccinated). Interestingly but not surprisingly, we observe the highest percentages of concerns about side effects in countries with the lowest vaccine acceptance rates. This suggests that concerns related to side effects may be one of the major underlying reasons for low vaccine acceptance.
How You Can Access the Data
The University of Maryland hosts all of the data used in this analysis and much more on their API. Details on the study design of the UMD Global CTIS including the sampling and weighting methodology has been published previously (read more about our partnership and study design, as well as sampling and weighting methods). The US version of the UMD Global CTIS and their aggregated data are also available for public use on their API. Individual-level data are available upon request from researchers. A list of other publications using these data are available on the Facebook Data for Good Website, as well as on this blog.
Updated on December 10, 2021:
Note on the limitations of the survey: The Global COVID-19 Trends and Impact Survey (CTIS), formerly known as the COVID-19 Symptom Survey, is subject to several limitations, many of which are common to web surveys. Anyone using the data to make policy decisions or answer research questions should be aware of these limitations, which are detailed here.
Given these limitations, we recommend using CTIS data to highlight trends across time or differences between groups, rather than focusing on total population estimates. We also strongly encourage users with access to the individual level data to consider whether additional corrections are needed to the weights, whether multiple imputation is needed to correct for missing data, and whether augmenting the survey with data collected from other sources, such as official data on testing, hospitalizations, and vaccinations or surveys that include respondents that do not have access to the internet, is needed for their research question(s)
To stay updated on survey questionnaire revisions and errors related to the survey instrument and data processing, sign up for our mailing list and check the Notices and Updates page regularly.
Privacy Statement
This survey was designed with privacy in mind from the start. The University of Maryland and Carnegie Mellon University do not share individual survey responses with Facebook, and while Facebook recruits participants to the survey, participants can’t be linked back to their Facebook profiles. When non-aggregated survey data is shared with eligible academic and nonprofit institutions, Facebook shares a single statistic known as a weight value, which doesn’t identify a person but helps researchers correct for any sample bias. This helps ensure that the survey sample more accurately reflects the characteristics of the population represented in the data.
Acknowledgement
Facebook’s team, including Kelsey Mulcahy, Kris Barkume, and Sid Palani assisted with the analysis and writing of this post. At the University of Maryland, Samantha Chiu and Adrianne Bradford assisted in conducting the survey. We also thank Sonja Malich from the Institute for Employment Research and Michael Herter from infas360, both in Germany, for cross-checking the data with local sources.
Author Affiliations
Frauke Kreuter is Co-Director of the Social Data Science center at the University of Maryland, Chair for Data Science for Social Science and Humanities at the Ludwig Maximilians University in Munich, Professor of Statistics and Data Science at the Ludwig Maximilians University in Munich, and Co-Director of the Data Science Center at the University of Mannheim.
Esther Kim is a Research Scientist on the Demography and Survey Science team at Facebook.
Andy Garcia is a Data Scientist on the Health team at Facebook.
Sarah LaRocca is a Research Scientist on the Demography and Survey Science team at Facebook.
Katherine Morris is a Research Scientist on the Demography and Survey Science team at Facebook.
Frances Wang is a PhD candidate in Epidemiology at the Johns Hopkins Bloomberg School of Public Health.
Carly Lupton-Smith is a PhD student in the Department of Biostatistics at the Johns Hopkins Bloomberg School of Public Health.
Ting-Hsuan Chang is a graduate student in the Department of Biostatistics at the Johns Hopkins Bloomberg School of Public Health.
Xiaoyi Deng is a faculty assistant in the Joint Program in Survey Methodology at the University of Maryland.
Andres Garcia is graduate research assistant at the University of Maryland Center for Geospatial Information Science.


